




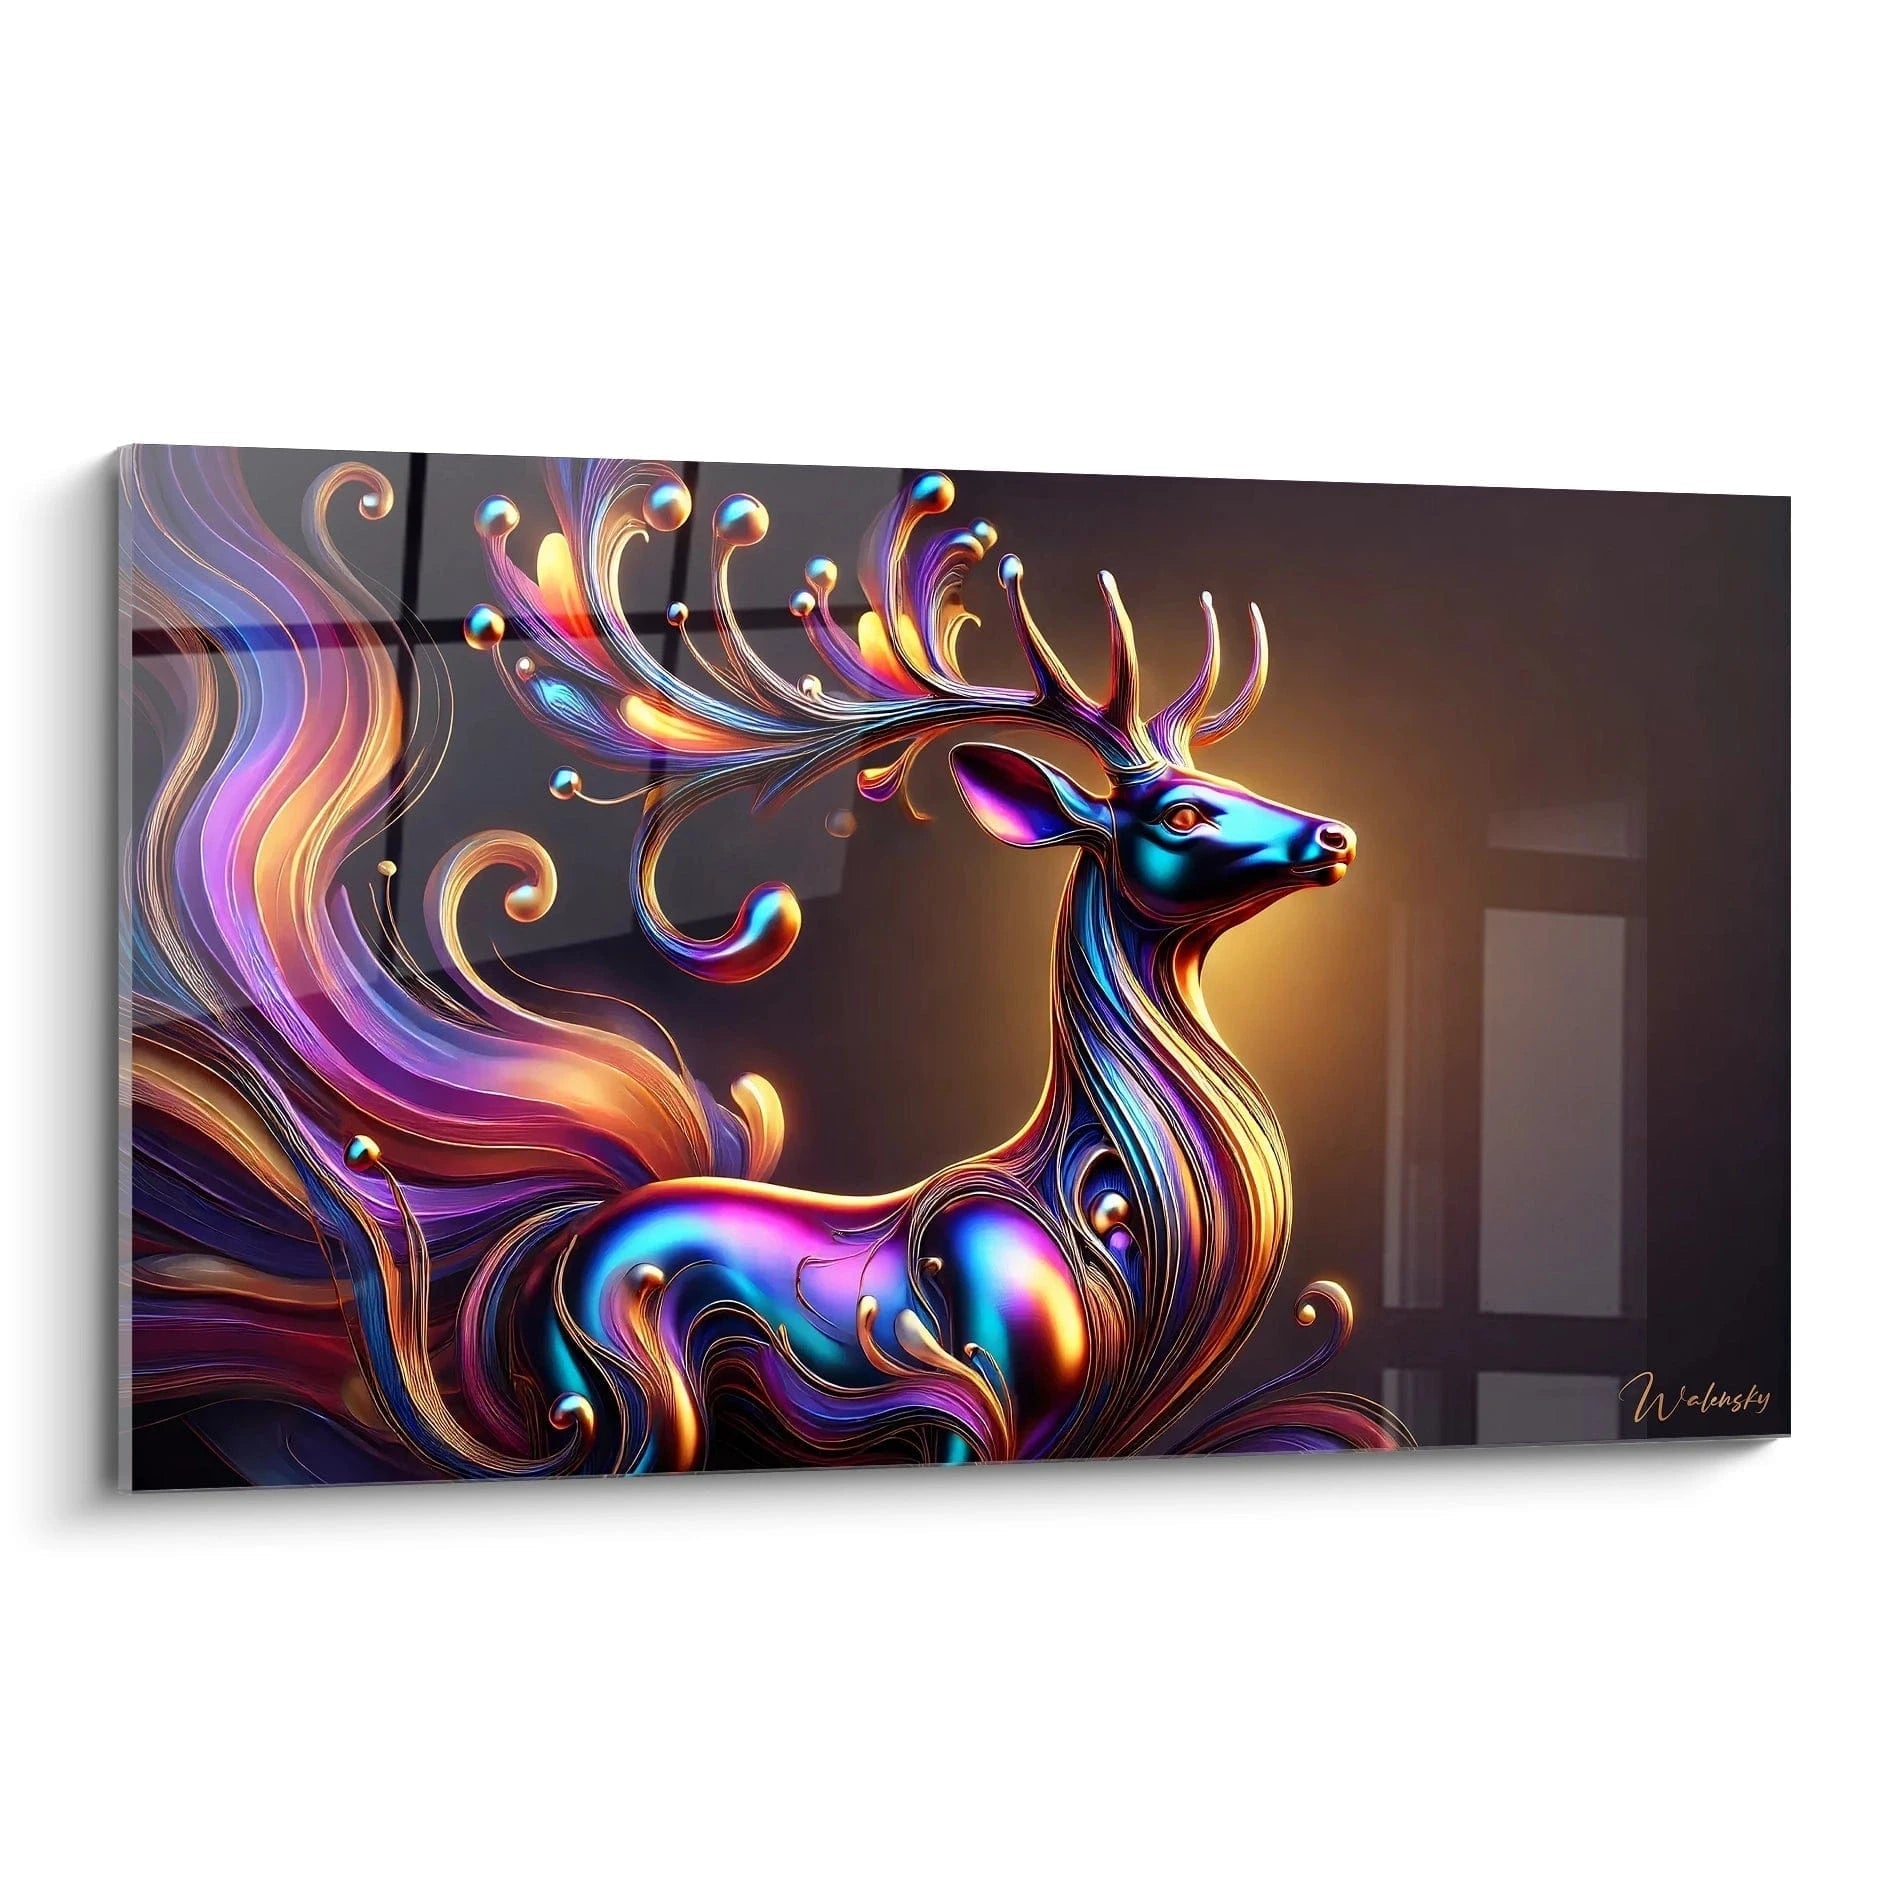


How Shopify analytics help you choose the best-selling painting formats?
8 min read · by Walensky
GAZELLE PAINTINGS
Three paintings, three formats, one homepage slot. It's the question every wall decor store manager asks on a Tuesday morning in front of their Shopify dashboard: which one to push? The square? The panoramic? The large A2 that costs more to store but makes the biggest impact?
The answer doesn't come from an aesthetic intuition. It comes from Shopify Analytics reports, provided you know where to look and what to cross-reference.
The direct answerShopify Analytics lets you identify the best-selling painting formats by cross-referencing three native reports: sales by variant (format/material), conversion rate per product page, and browsing behavior (clicks, add-to-cart actions). By comparing this data format by format within the same collection, you quickly see whether the square converts better than the panoramic, or whether a large format generates more margin despite lower traffic.- The "Sales by variant" report reveals which format (L, XL, XXL...) actually sells, beyond the generic product.
- The conversion rate per product page distinguishes formats that attract clicks from those that turn into orders.
- Crossing format with material (acrylic glass or Alu Dibond) further refines your reading of customer preferences.
Why is format a key performance variable on Shopify?
The same visual offered in several formats never sells equally. It's almost counterintuitive: one imagines the customer first chooses the image, then the size that suits them. In reality, the format often determines the purchase decision itself, before even the aesthetic choice.
Take a 120x40 cm panoramic painting: it targets a specific use, above a sofa or a wide headboard. A 100x100 cm square format meets a different need, that of a dense central wall. These two formats don't address the same buyer, and their conversion rates often prove it. For a modern living room, choosing a landscape-format acrylic glass painting follows that same logic.
This proportion rule partly explains why certain formats dominate certain collections. A living room with a 220 cm sofa naturally calls for a wide format, while a hallway or entrance pushes toward more compact pieces. Analytics simply confirm, with figures, what spatial logic already suggests.
Format isn't a minor product-page detail: it's often the first variable deciding whether a visitor buys or closes the tab.
The Shopify reports to monitor for analyzing sales by format
Three native reports are enough in most cases, without any third-party app. You just need to know how to read them together rather than in isolation.
Sales by product variant report
In Analytics > Reports > Sales, the "by variant" breakdown shows the quantities sold for each format/material combination of a single product. It's the most telling report: it shows in black and white whether the XL sells three times more than the 4XL on a given visual.
Export this report over several months, not fifteen days. Wall decor purchases follow cycles (back-to-school, holidays, spring) that distort a too-short reading.
Behavior report and click-through rate per product page
The "Most viewed products" report, cross-referenced with sessions per page, shows which formats generate clicks without necessarily converting. A format that attracts many views but few sales deserves a price or photo adjustment, not removal from the catalog.
Conversion rate by variant isn't native on all Shopify plans. If your plan doesn't show it in detail, combine the sales-by-variant report with the sessions-per-product report to recalculate it manually.
Shopify Analytics is enough for this first analysis. A third-party app (Triple Whale, Lifetimely, or equivalent) only becomes useful if you manage several hundred references and want to automate recurring dashboards.

Favourite
Gift Painting Candied Citrus Warmth - Christmas Edition
From €273.90
Discover this paintingStep-by-step method for cross-referencing sales data and painting formats
Here is the sequence that turns raw figures into a concrete catalog decision.
- Isolate a coherent collection. Compare formats against each other within the same visual universe (abstract, animal, geometric), never across mixed collections.
- Export sales by variant over 3 to 6 months. Note for each format: quantity sold, revenue, share of total.
- Calculate the conversion rate by format. Divide orders by the sessions that viewed that specific variant.
- Cross-reference with the chosen material. Acrylic glass and Alu Dibond don't attract the same buyer: a format that underperforms in acrylic glass may do very well in Alu Dibond, and vice versa. This material choice is especially decisive for acrylic paintings for a home office, where visual impact also shapes daily motivation.
- Decide by tier. A format that underperforms across several different visuals of the same collection isn't an accident: it's a signal to drop it from your featured placements, or even from custom offerings.
how performance data already guides the choice of best-selling paintings details the overall logic behind this method, if you want the pure data angle rather than the format focus.
— Our selection


Concrete examples with paintings from the store
In an animal collection, comparing sales by variant often reveals clear gaps between landscape and square formats. A graphic feline painting in brown and beige tones, designed in a wide landscape format, generally attracts buyers looking for a centerpiece above a sofa.
Conversely, a more graphic, high-contrast visual, such as an animal composition in black and green, may perform better in a very large format (3XL or 4XL) if the data shows a higher average basket on those sizes, even with lower sales volume.
In a street art or graphic collection, panoramic formats often come into play differently: a visual with fine geometric lines suits a stretched width well, while a more figurative subject remains better in a classic landscape.
It's by repeating this reading visual by visual, format by format, that a real map takes shape: some subjects call for the square, others for the wide landscape, others still for the stretched panoramic. Analytics guess nothing; they confirm or refute a starting hypothesis.
Going further: combining format analytics, loading speed and performance sharing
A format that converts poorly may hide a speed problem, not a taste problem. A product page with several large-size variants sometimes loads more slowly, especially if the visuals aren't optimized, and this mechanically skews the measured conversion rate.
Before condemning a format on figures alone, check the loading speed of the page concerned. our guide on sharing Shopify performance explains how to circulate these findings internally, between the product team and the marketing team, without the information getting lost in a forgotten spreadsheet.
Format data only has value when shared: a store that analyzes its sales by variant but never passes the conclusion on to whoever manages restocking or featured placements redoes the same work every quarter, for nothing.

You might also like
Geometric Cat Painting - Abstract Grace - Serengeti Cat Edition
From €273.90
Discover this painting →Frequently Asked Questions
Which Shopify reports show sales by product format?
The "Sales by variant" report, accessible from Analytics > Reports > Sales, displays quantities and revenue for each format/material combination of a given product.
How do you know which painting format sells best online?
Compare the conversion rate by variant across several visuals of the same collection, over at least three months, isolating seasonal effects.
Is Shopify Analytics enough or do you need a third-party app?
Native reports are enough for most stores. A third-party app only becomes useful beyond several hundred references, to automate recurring dashboards.
How can analytics data help reduce dead stock of certain formats?
Identify formats that underperform across several different visuals of the same collection: this is a reliable signal to reduce their featured placement or remove them from custom offerings, rather than judging a single isolated product.
Analytics never replace the eye that chooses a piece for its living room. But they stop you from betting an entire stock on a fragile intuition. Cross-referencing format, material and conversion, visual after visual, turns a catalog into a sales tool rather than a frozen collection.
The Gazelle Paintings collection remains a solid real-world example of this method: several formats, one shared visual universe, and data that speaks for itself once you know where to look.
Explore our collections


